Quarterly Market Update – August 2021

August 2021

ItemCountry of OriginBeginning of harvestEnd of harvestReport Quarter
Baby CornThailandYear roundYear roundCrop yields are as expected. Cost increases are due to Thailand in-country transportation costs, as well as packaging and tin costs.
Tuna AlbacoreThailandYear roundYear roundCatchings are steady. Demand overall is lower. This is offset by cost increases in Thailand in-country transportation costs, as well as packaging and tin costs.
Tuna  SkipjackThailandYear roundYear roundCatchings are steady. Demand overall is lower. This is offset by cost increases in Thailand in-country transportation costs, as well as packaging and tin costs.
Canned MushroomsHollandYear RoundYear RoundRaw material costs have increased, as well as packaging costs and supply chain costs. The supply of mushrooms is steady, but worldwide demand is very high.
PineappleThailandDecJanCrop yields are as expected. Cost increases are due to Thailand in-country transportation costs, as well as packaging and tin costs.
Water ChestnutsChinaNovMarCrop yields and raw material processings are going to be dependent on labor availability. Increased packaging costs, as well as a depreciating US dollar vs the Chinese Yuan will contibute to higher costs.
Olive OilSpainNovMarDemand worldwide is increasing, and pricing will remain at current levels due to relatively low global production for 2020/21. The projected carryover from previous crop are at multi-year lows, and Spain’s water reserves are at a 5-year low. Expected high summer temperatures may affect crop development.
CapersTurkeyJunAugThe 2021 harvest is currently in process and is producing solid crop yields. Foodservice demand is rebounding and pricing is currently stable but could change.
Jalapenos/ TomatillosMexicoJulAugThe Mexican summer crop looks good and farmers are currently sending raw materials to processors for canning.
ArtichokesPeruAugNovThe Peruvian harvest starts late in July and is very close to being sold out. The global demand for booking is very strong due to a large decrease in volume of the Spanish crop. Base costs from Peru will be increasing 8-10% due to mandated wage increases, packaging costs, and logistics expense.
Olives SpainOctFebFoodservice demand has increased, and the forecast for 2021 Spanish harvest indicates there could be lesser yields, pushing raw material costs higher. Costs could be marginally offset by an improved exchange rate and reduced import duties.
PepperonciniGreeceJulSepThe harvest is just beginning in Greece and looking positive with normal quantities and quality for this season.
RaspberriesSerbiaJulSepSignificant warm weather in both the Pacific northwest and Serbia is going to have an impact on crop size and yield. There is currently a large demand in the market, and zero carryover of product from previous crops. Normally carryover is 20-30m lbs. going into the European season. The combiation of zero carryover and a short crop will send prices extremely high this season.

Logistics Update

boat

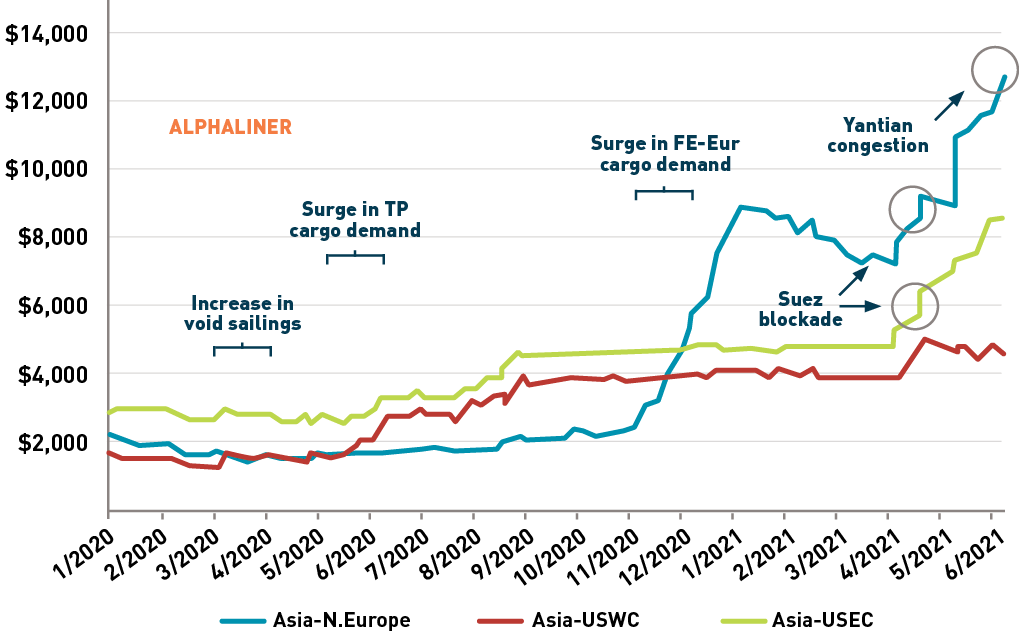
As importers vie to replenish depleted inventories and keep up with strong demand,  industry experts predict international supply chain costs have not yet peaked. Ocean carrier service performance is at all time lows as well. Schedule reliability for ocean carriers is about 35% to 40% globally, according to Sea-Intelligence. Three-quarters of vessels that are late by 10 days. Industry analysts don’t expect demand to curtail or the industry dynamics to drastically change until late Q1 into mid-2022.

However, Savor Imports has implemented a number of tactics since April to offset shipping delays, some of the incremental expenses, and build safety stock inventories. The tactics are working. Savor received 29 containers in one week mid-August and had 69 more in transit at that time. We are expecting our service levels to rebound to more traditional numbers the next 30 days. 

We will stand committed to communicating any temporarily out of stock situations to assist you inform your operator customers. 

Global Schedule Reliability
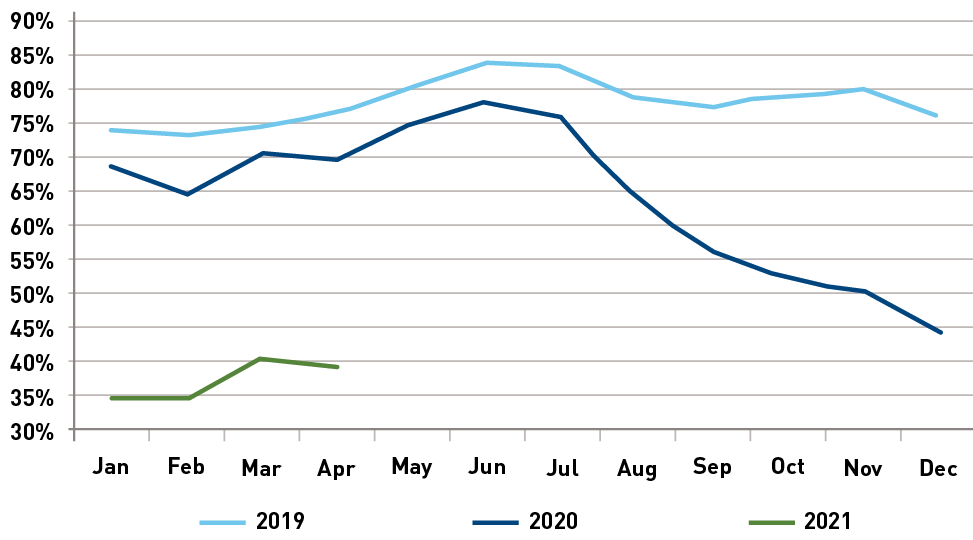
global reliability graph 1
global reliability graph 2